Configuring Column Groupings
How Column Groupings Work
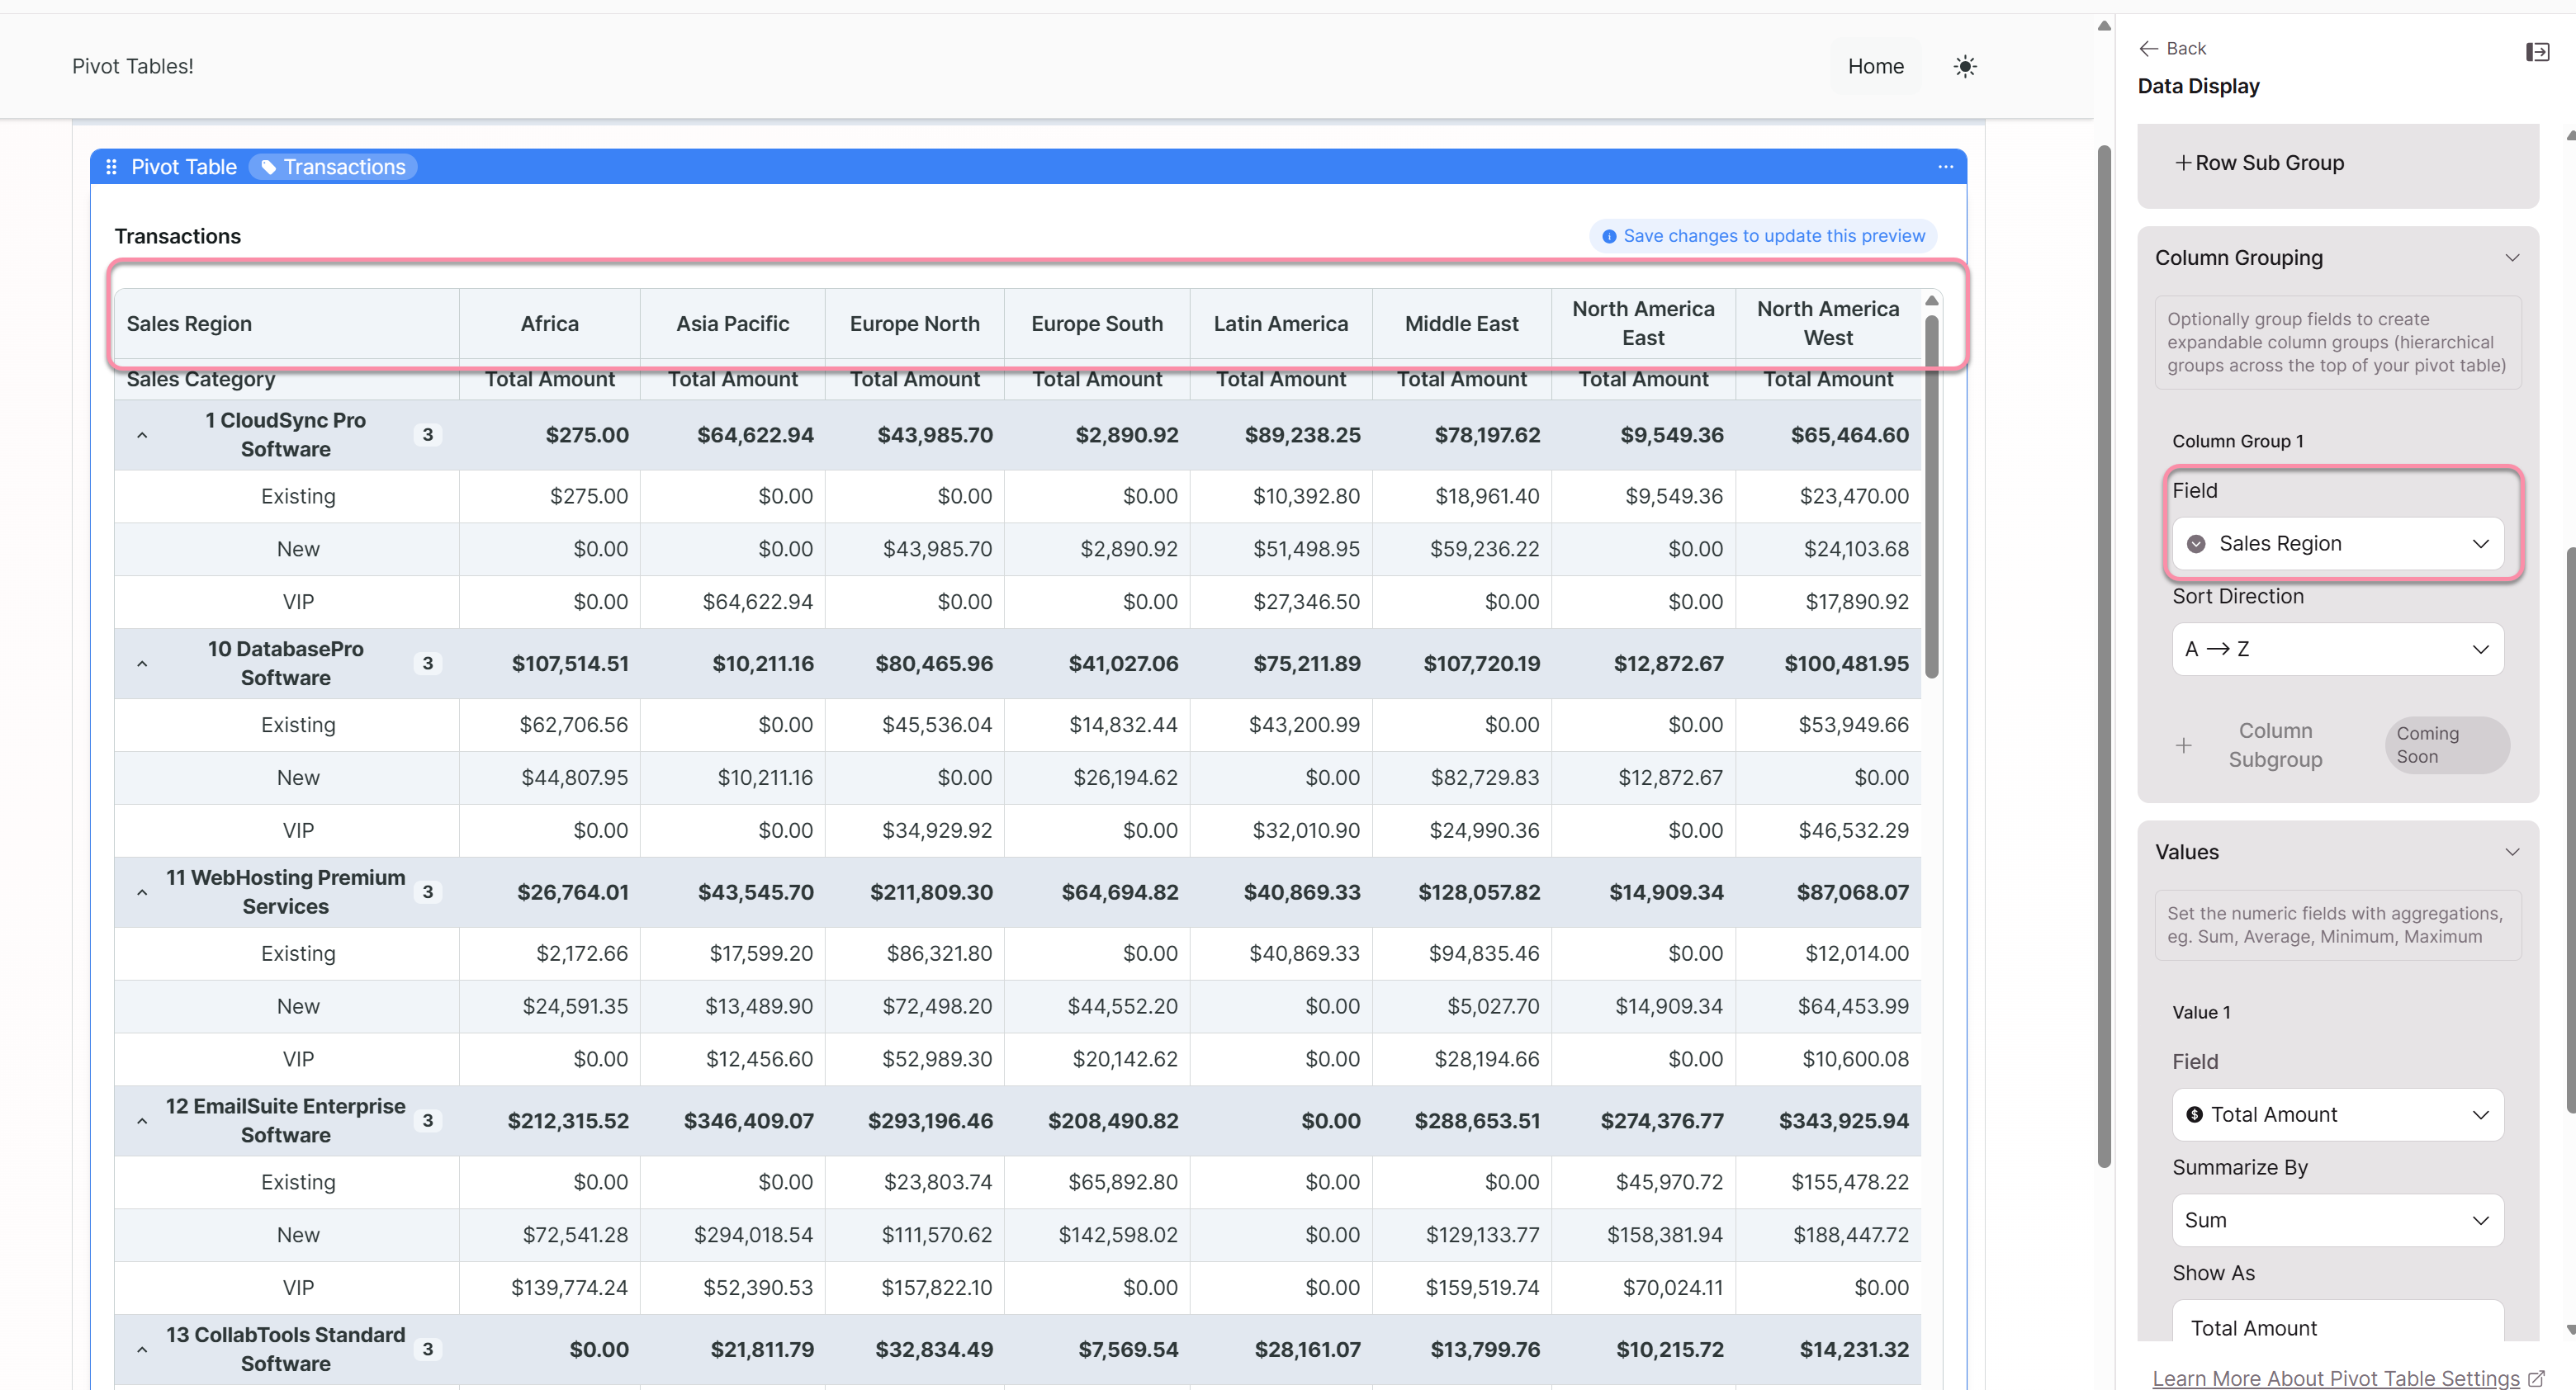
Column groupings create the top header categories in your pivot table. Each unique value in your column grouping field becomes a separate column. The intersection of each row and column displays your calculated values.
For example, if you group columns by "Sales Region" and your data contains North, South, East, and West, your pivot table will have four data columns—one for each region—plus any summary columns you've enabled.
Choosing Your Column Grouping Field
In the Data Display panel, select a field for Column Grouping. Consider these factors:
Number of unique values matters most. Too many unique values create a very wide table that requires horizontal scrolling and becomes difficult to compare across. Too few values may not provide meaningful comparison points.
| Unique Values | Usability |
|---|---|
| 3-8 | Ideal — fits on screen, easy to compare |
| 9-15 | Acceptable — may require some scrolling |
| 16-30 | Challenging — comparison becomes difficult |
| 30+ | Not recommended — consider using as row grouping instead |
Good choices for column groupings:
- Time periods (quarters, months, years)
- Geographic regions
- Status values (Active, Pending, Closed)
- Categories with limited options (Customer Type: B2B, B2C, Partner)
- Rating levels (High, Medium, Low)
Column Grouping vs. Row Grouping
When deciding whether a field should be a row or column grouping, consider:
| Use Row Grouping When... | Use Column Grouping When... |
|---|---|
| Field has many unique values | Field has few unique values (under 15) |
| You want hierarchical drill-down | You want side-by-side comparison |
| You're analyzing "what" categories | You're analyzing "across" dimensions |
| Labels are long text | Labels are short (fit in column headers) |
Example: "Product Name" (potentially hundreds of values) works better as a row grouping. "Quarter" (only 4 values) works better as a column grouping.
Single vs. Multiple Value Fields
When you have multiple value fields configured (e.g., both Sum and Average), each value gets its own column within each column grouping category. This means your effective column count is:
Total columns = (Unique column grouping values) × (Number of value fields) + Summary columns
For example, 4 regions × 2 value fields = 8 data columns, plus any grand total columns.
Keep this multiplication effect in mind when planning your configuration. A column grouping with 10 values combined with 3 value fields creates 30 data columns—likely too wide for comfortable viewing.
Sorting Column Order
Columns appear in the order determined by the field's values. For text fields, this is typically alphabetical. For date fields, this is chronological.
If you need a specific column order that doesn't match the default sort, consider whether your source data can be structured to produce the desired order (e.g., using "Q1", "Q2", "Q3", "Q4" for quarter names ensures correct chronological sorting).
When to Skip Column Grouping
Column grouping is optional. You can create useful pivot tables with only row groupings:
- Summary by category: Row group by Department, Value shows Total Budget → produces a simple one-column summary
- Multiple metrics comparison: Row group by Product, Values show Sum, Average, and Count → produces a multi-column view without a column grouping field
This approach works well when you're summarizing data by a single dimension and don't need cross-tabulation.
Best Practices
Preview with actual data. A field you expect to have 5 values might have 50 in production. Always verify the actual number of unique values before finalizing your column grouping choice.
Favor comparison over comprehensiveness. The power of column groupings is enabling side-by-side comparison. If a field has too many values to compare meaningfully, it's better as a row grouping where users can scan vertically.
Consider your audience's screen size. Mobile users and those with smaller monitors will struggle with wide pivot tables. If your audience varies, keep column count conservative.
Watch for sparse data. If many row/column intersections will be empty (no matching records), your pivot table will have lots of blank cells. This might indicate that your grouping combination is too granular.
Related: Pivot Tables Overview | Row Groupings | Values and Calculations