Quick Start: Create Your First Pivot Table
Before You Start
You'll need:
- A Next-Gen App (pivot tables are not available in Classic)
- A table with data to analyze (this tutorial uses a Transactions table as an example)
- At least one numeric field for calculations (e.g., amounts, quantities)
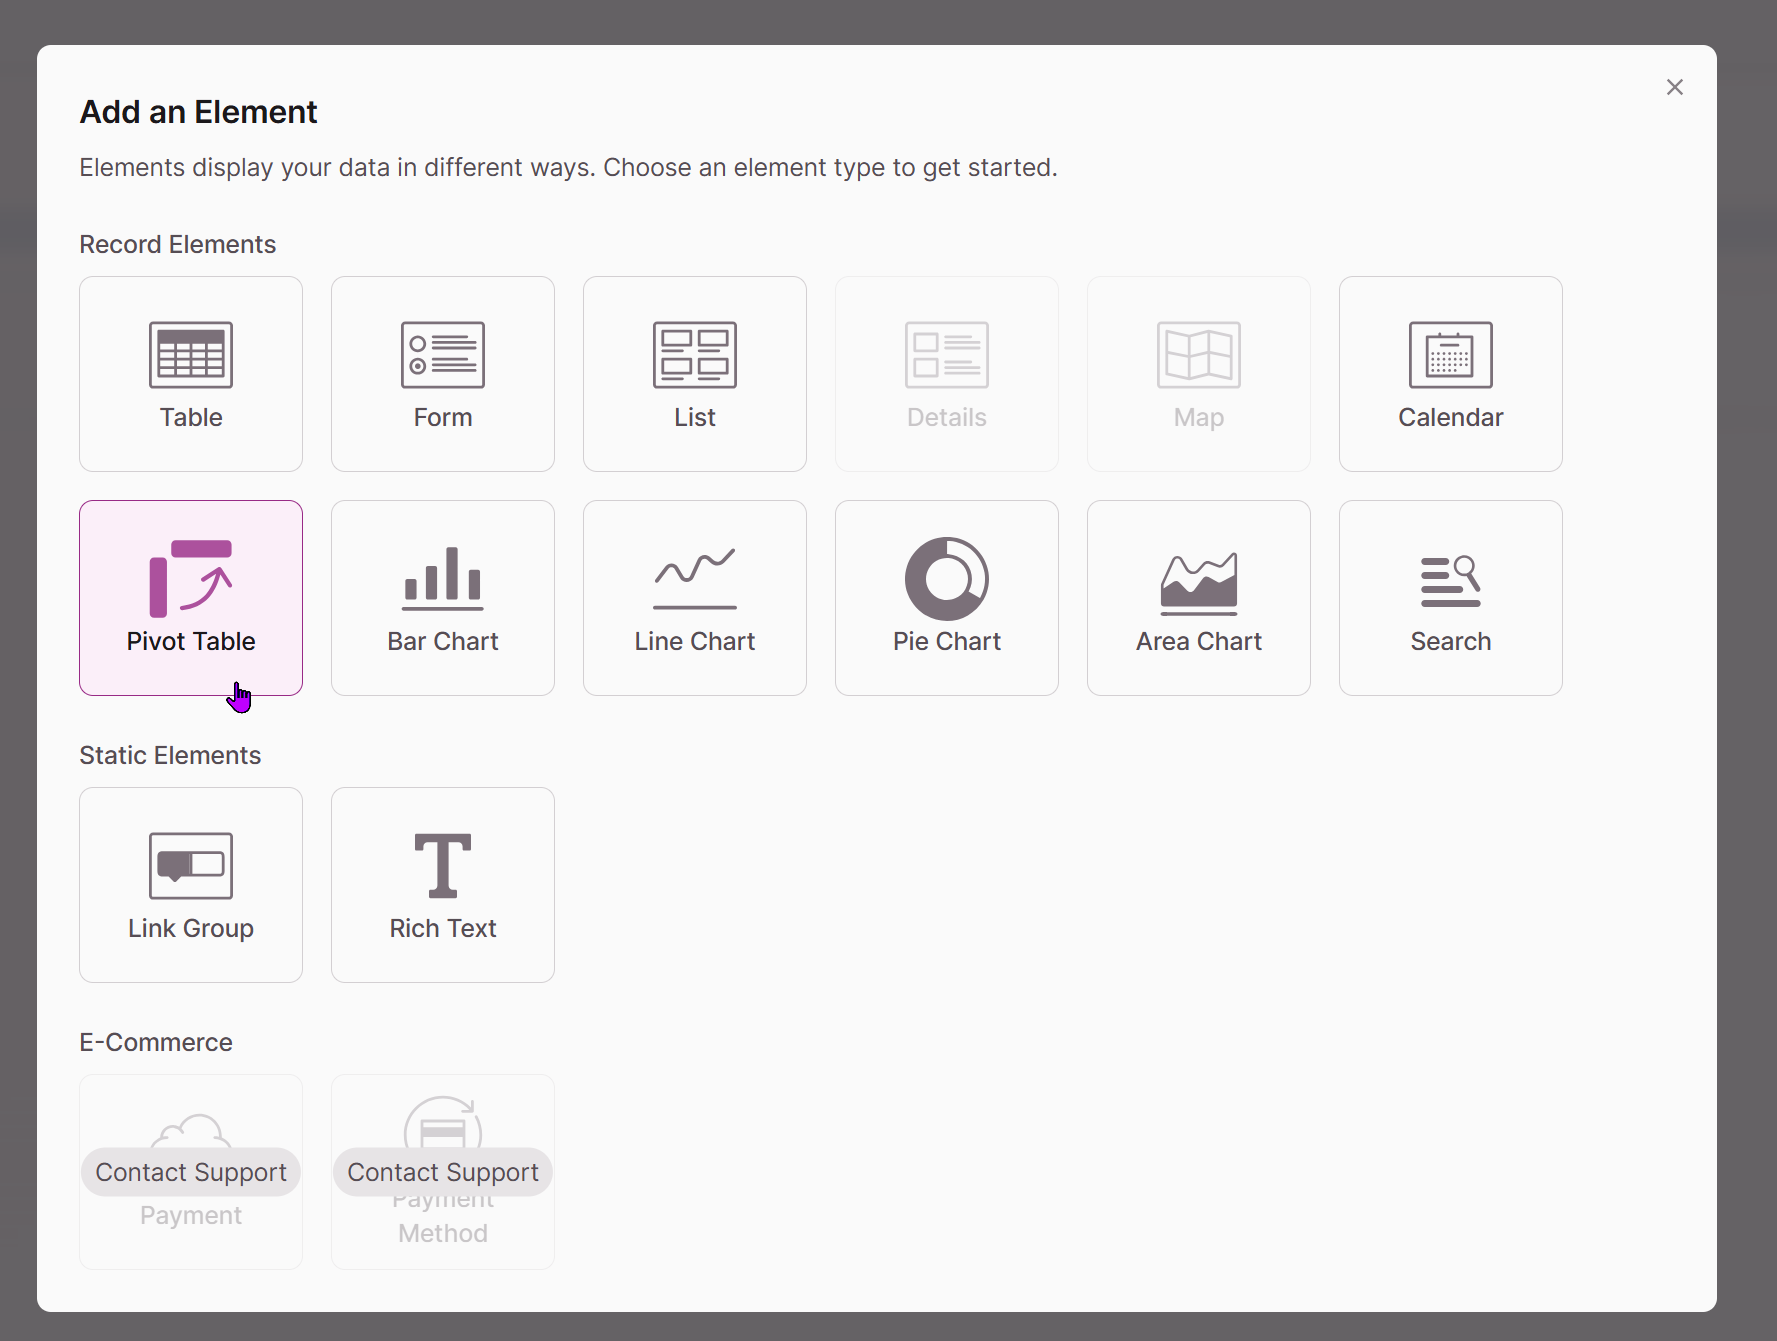
Step 1: Add the Pivot Table Element
Open your page in the Builder and add the Pivot Table element from the element panel.
Step 2: Select Your Data Source
Choose the table containing the data you want to analyze. In this example, we'll use a Transactions table that includes Products, Sales Regions, and transaction amounts.
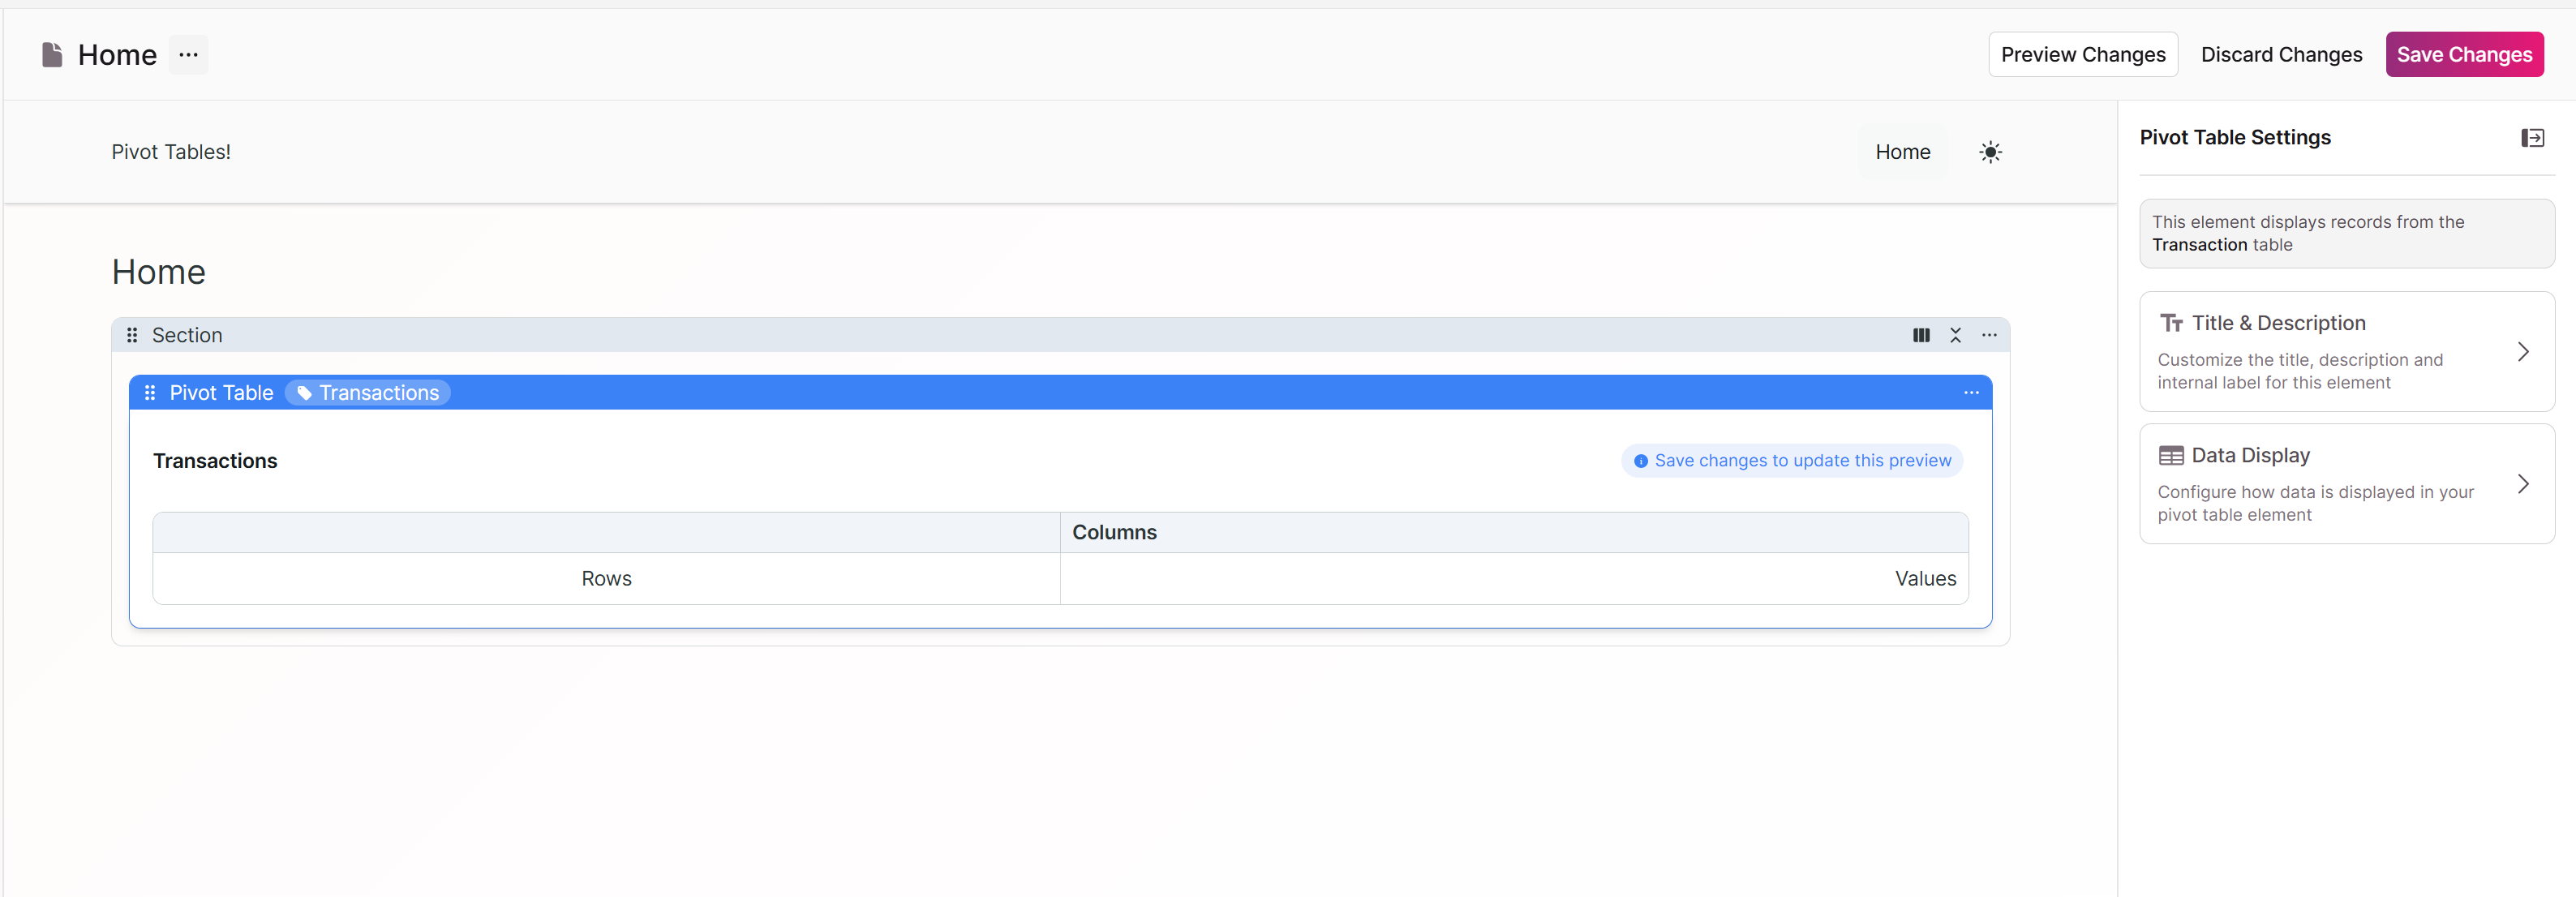
The empty state of pivot tables. Save changes to view updates.
Choosing a good data source: Pivot tables work best with normalized data where each row represents a single record or transaction. If you need fields from related tables, you can access them through connection fields.
Step 3: Configure Your Groupings and Values
Open the Data Display tab to configure how your data will be organized and calculated.
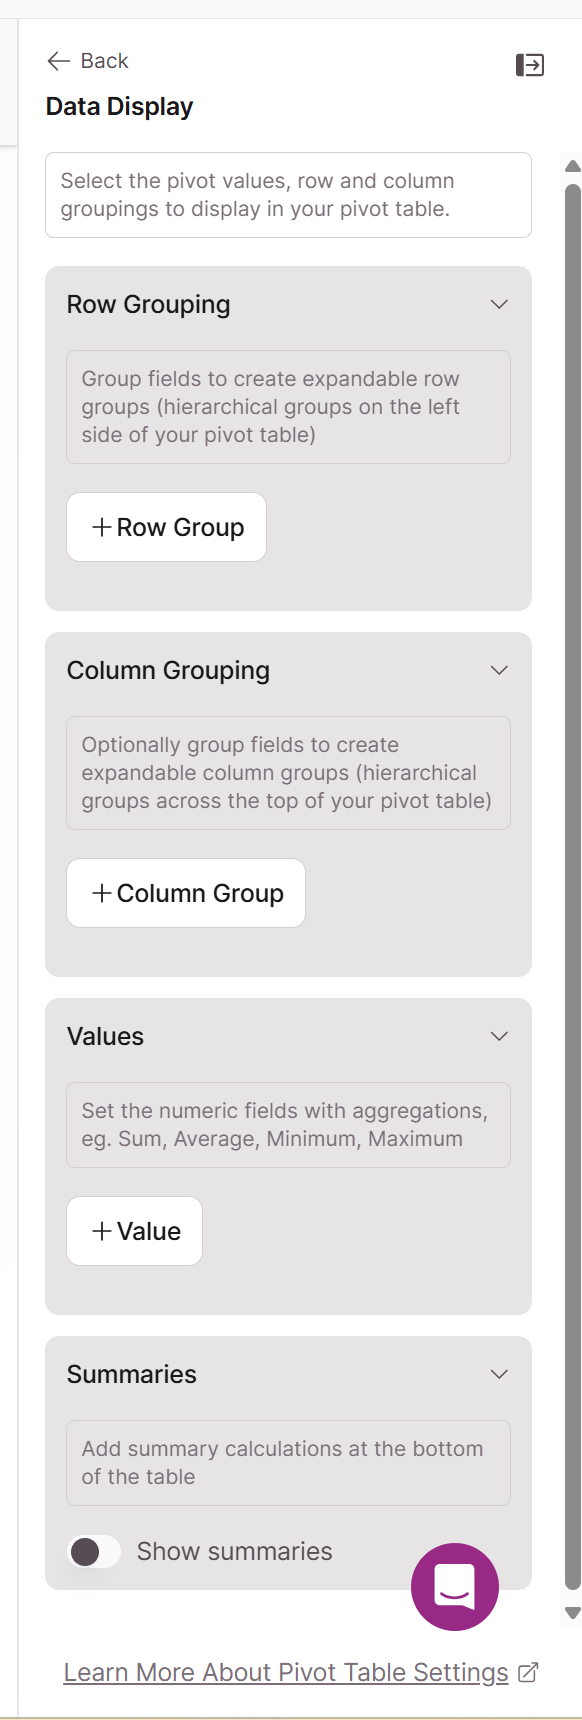
For this example, set:
- Row Group: Sales Category
- Column Group: Sales Region
- Values: Total Amount (Sum)
Step 4: Save and View
Save your changes to generate the pivot table. You'll see a cross-tabulated view showing total revenue for each product category across different regions.
What You Built
Your pivot table now displays:
- Rows: Each sales category as a separate row
- Columns: Each region as a separate column
- Cells: The sum of transaction amounts where each category and region intersect
This gives you immediate insight into which product categories perform best in which regions.
Next Steps
Now that you have a working pivot table, you can:
- Add a second row grouping to create drill-down hierarchy (e.g., Category → Customer Type). See Configuring Row Groupings.
- Add multiple value fields to show different metrics side by side (e.g., Sum and Average). See Values and Calculations.
- Enable summaries to show row totals and grand totals. See Values and Calculations.
Tip: Start simple. Add complexity like secondary groupings or additional calculations only after your basic structure is working correctly.
Troubleshooting
Pivot table shows no data: Verify your source table contains records. Check that your selected fields have values.
Too many columns: If your column grouping field has many unique values, the table becomes hard to read. Choose a field with fewer distinct values, or consider using it as a row grouping instead.
Values don't look right: Confirm you selected the correct summarization method. Sum adds values together; Count shows the number of records; Average calculates the mean.
Related: Pivot Tables Overview | Row Groupings | Column Groupings | Values and Calculations