Interactive Chart Data Exploration
Enable users to click chart elements and instantly view the underlying records in a detailed table view.
What you'll learn:
- How to enable clickable chart exploration
- How the automatic detail page works
- Ways to customize the drill-down experience
- Best practices for interactive data visualization
Overview
Charts in Next-Gen apps support interactive data exploration. When you enable this feature, users can click on any chart element—such as a bar, pie slice, or data point—to view the underlying records in a table that opens in a modal.
This transforms static charts into dynamic exploration tools, allowing users to move seamlessly from high-level insights to detailed record information.
Enabling Interactive Charts
To make your charts interactive:
- Select your Chart element in the builder
- Navigate to the Settings panel
- Enable the "Click to expand group records" setting
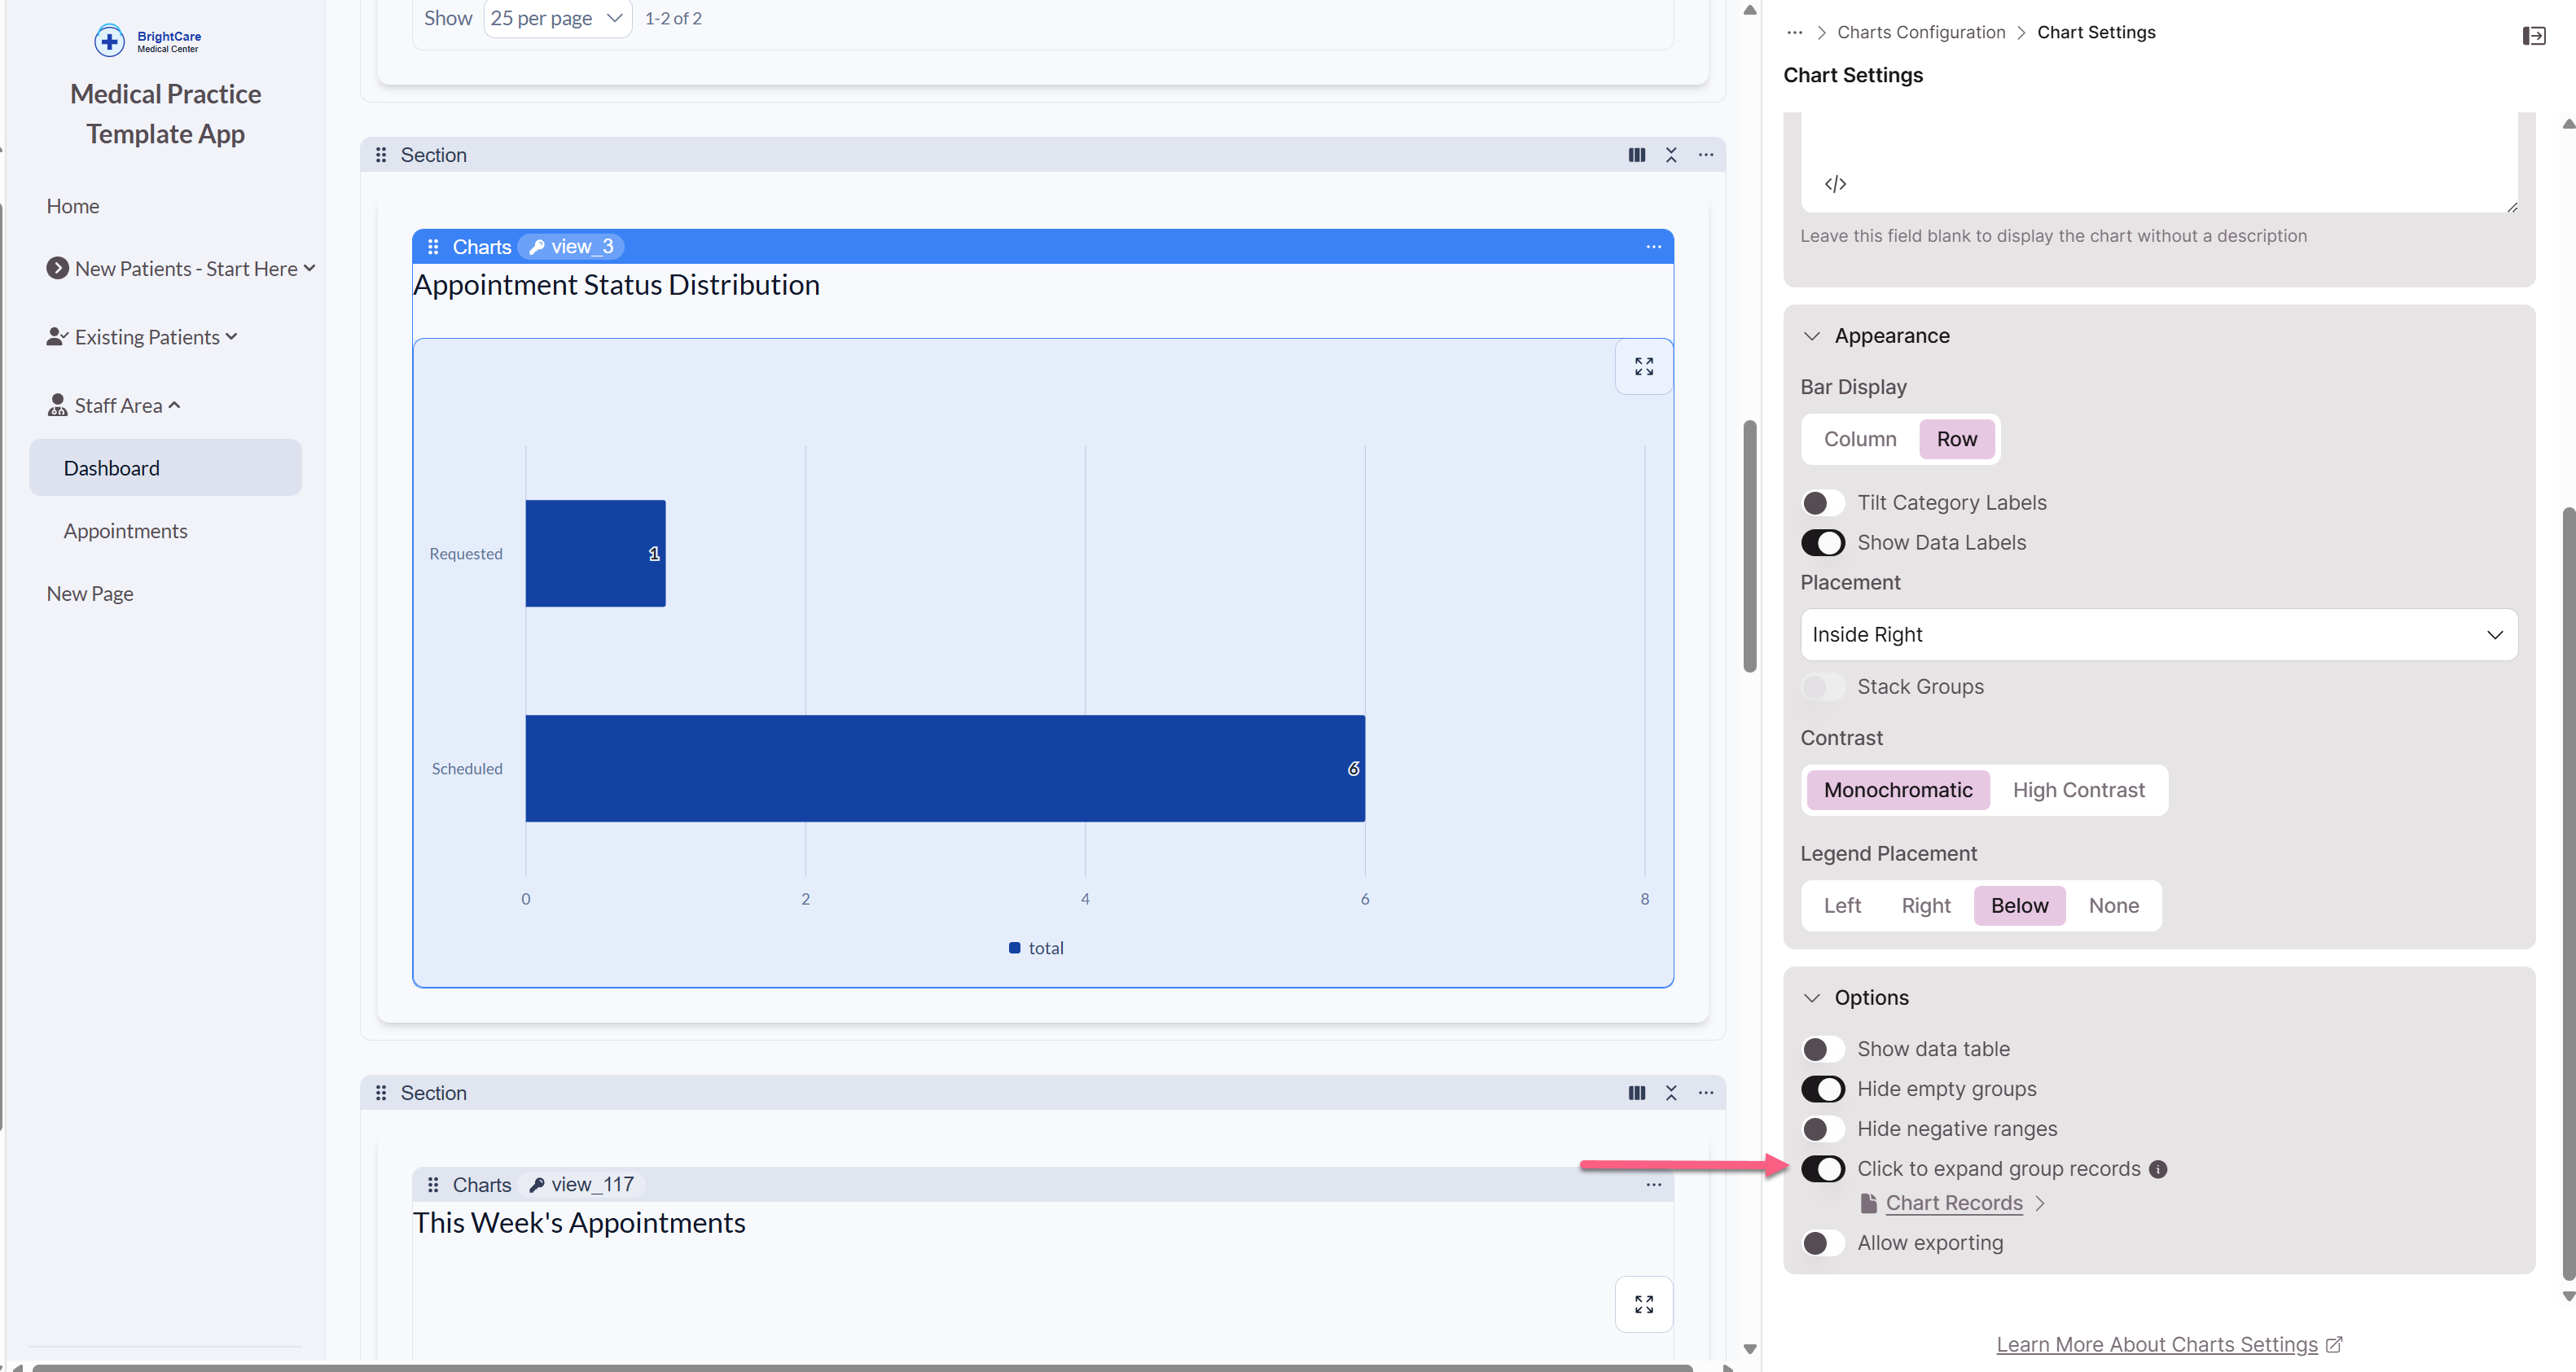
When you toggle this setting on, Knack automatically:
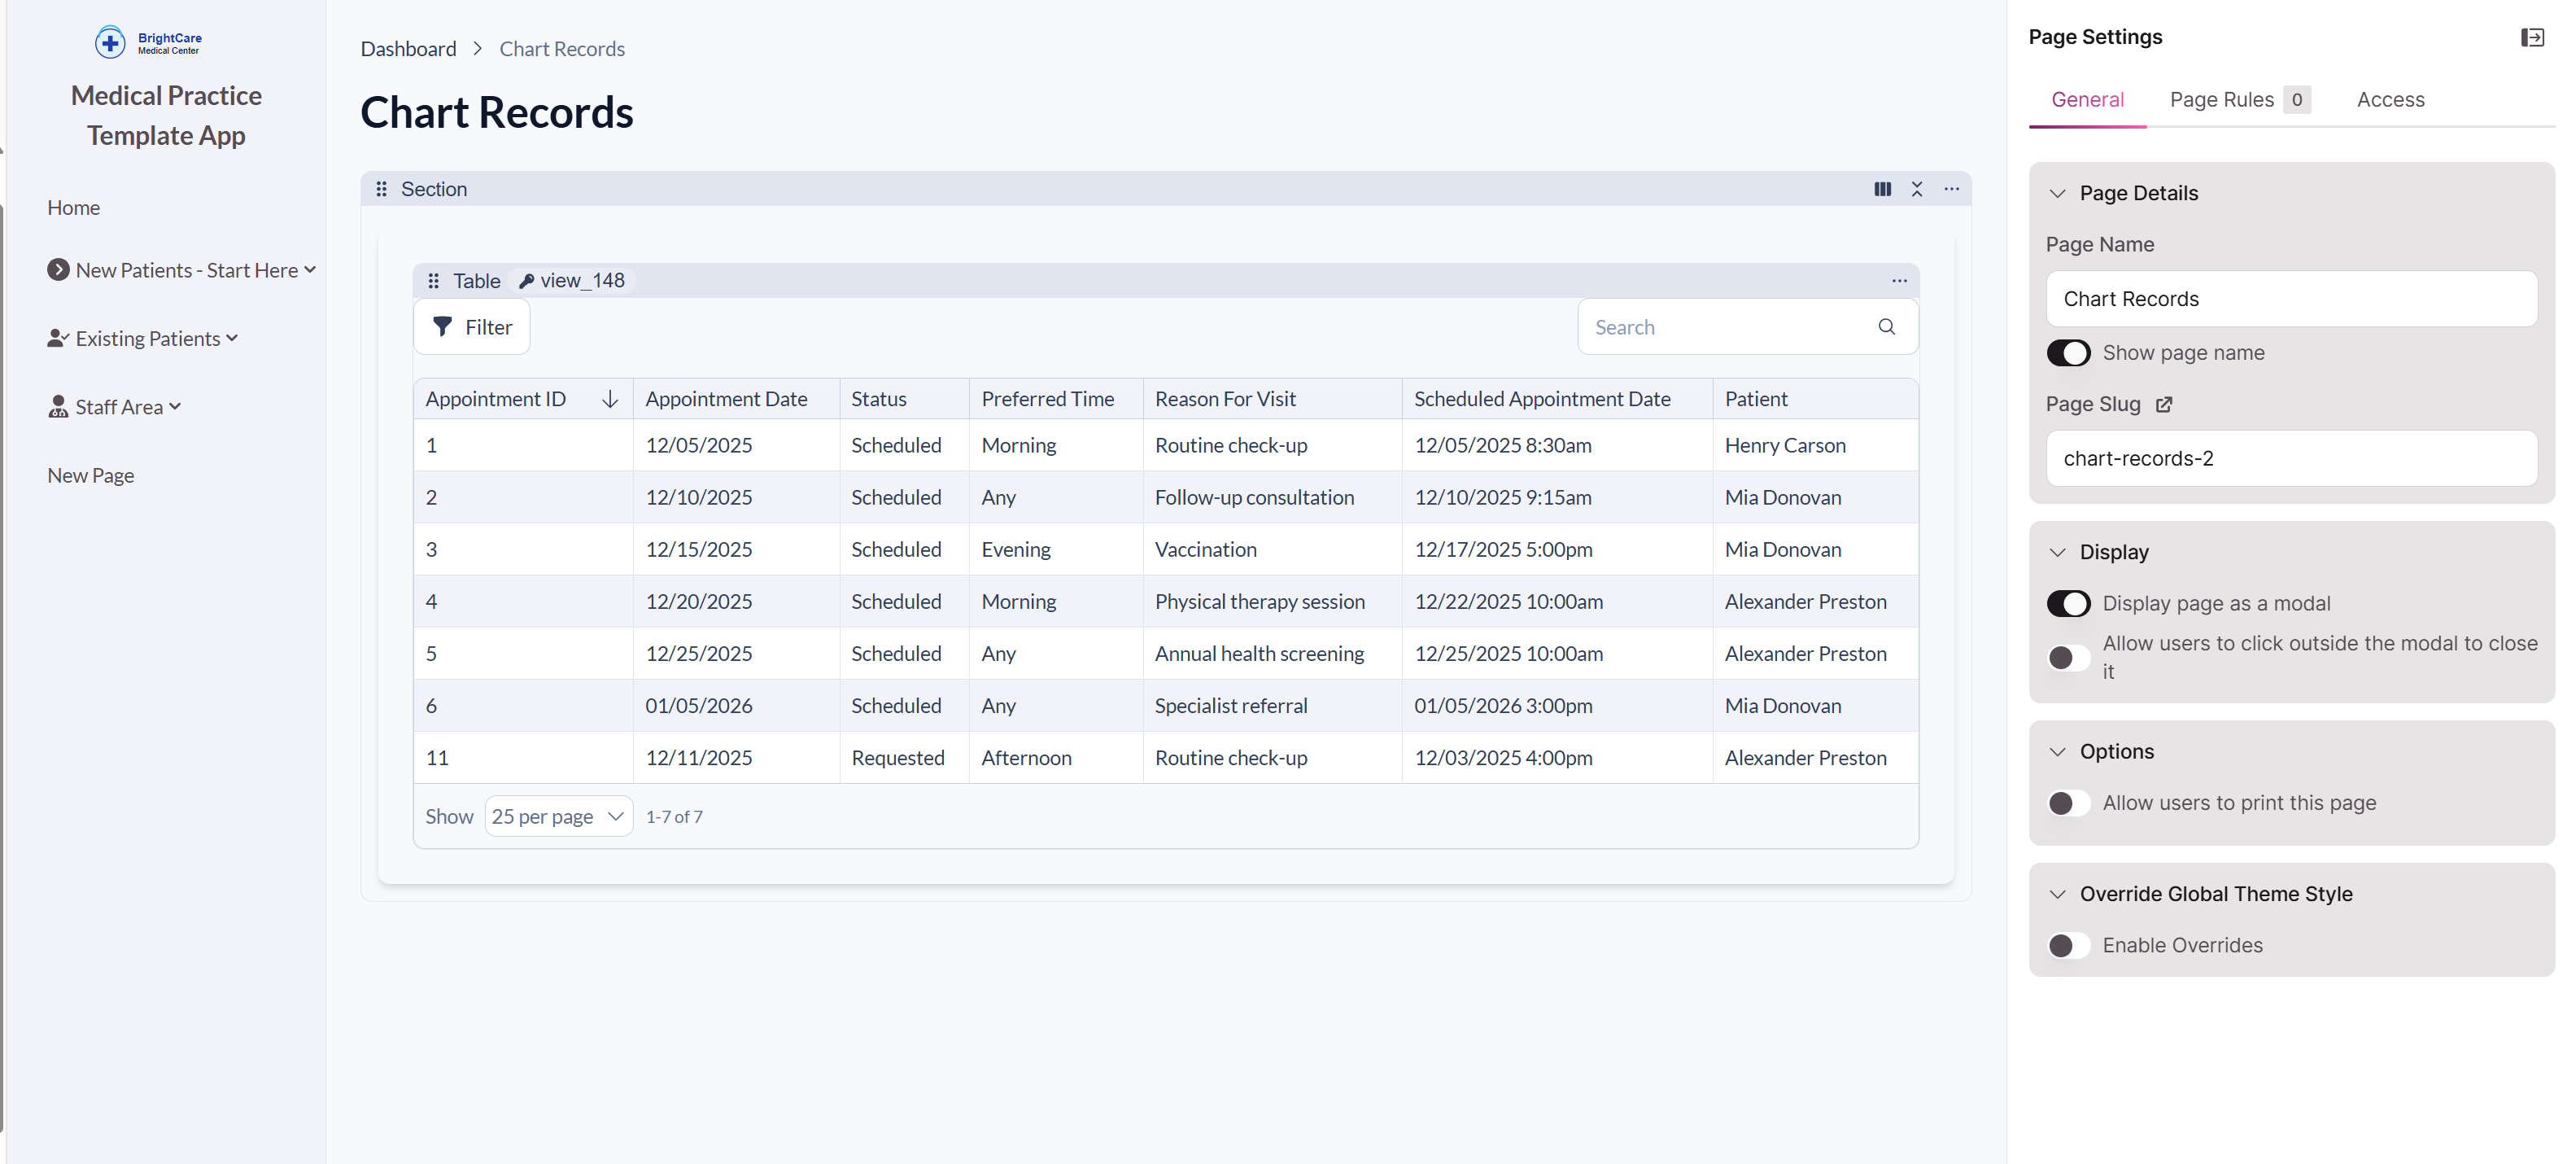
- Creates a child page connected to your chart
- Adds a Table element to display the underlying records
- Configures the page to open as a modal by default
- Sets up filters so the table shows only records from the clicked chart segment
How It Works for Users
When a user interacts with an interactive chart:
- They click on any chart element (bar, slice, line point, or area segment)
- A modal opens displaying a table of the underlying records
- The table shows only records that contribute to that specific chart element
- Users can review record details, then close the modal to return to the chart
Example: If a user clicks on a "March" bar in a monthly revenue chart, the modal displays a table showing all transactions from March.
Customizing the Detail View
The automatically created child page and table provide a starting point that you can customize to meet your needs.
Changing the Display Format
By default, the detail page opens as a modal. To change this:
- Select the Chart element
- Go to the Navigate to setting
- Choose either:
- Modal (default) - Opens in an overlay
- Same Page - Navigates away from the chart
Adding Additional Elements
You can enhance the detail page beyond the basic table:
- Add instructional text to guide users
- Include summary metrics for the filtered data
- Add related charts or visualizations
- Insert action buttons for common tasks
Any elements you add to the child page will automatically inherit the same filters as the table, ensuring they display data relevant to the clicked chart segment.
Modifying the Table
Customize the automatically created table to show the most relevant information:
- Adjust which fields appear as columns
- Reorder columns for optimal layout
- Configure column widths and formatting
- Add or modify table actions
Supported Chart Types
Interactive data exploration works with:
- Bar charts - Click any bar to see contributing records
- Area charts - Click data points to explore underlying data
- Pie charts - Click slices to view segment details
- Line charts - Click points along the line to drill down
Common Use Cases
Interactive charts are particularly valuable for:
Sales Analysis
Click on revenue bars to review individual deals, contacts, or transactions that contributed to each period's total.
Support Monitoring
Click on ticket status segments to see all cases in a particular state, making it easy to triage or reassign work.
Project Tracking
Click on task completion data points to drill into specific deliverables, milestones, or team assignments.
Operational Dashboards
Allow stakeholders to explore summary metrics by clicking through to detailed operational data without leaving the dashboard.