Configuring Row Groupings
How Row Groupings Work
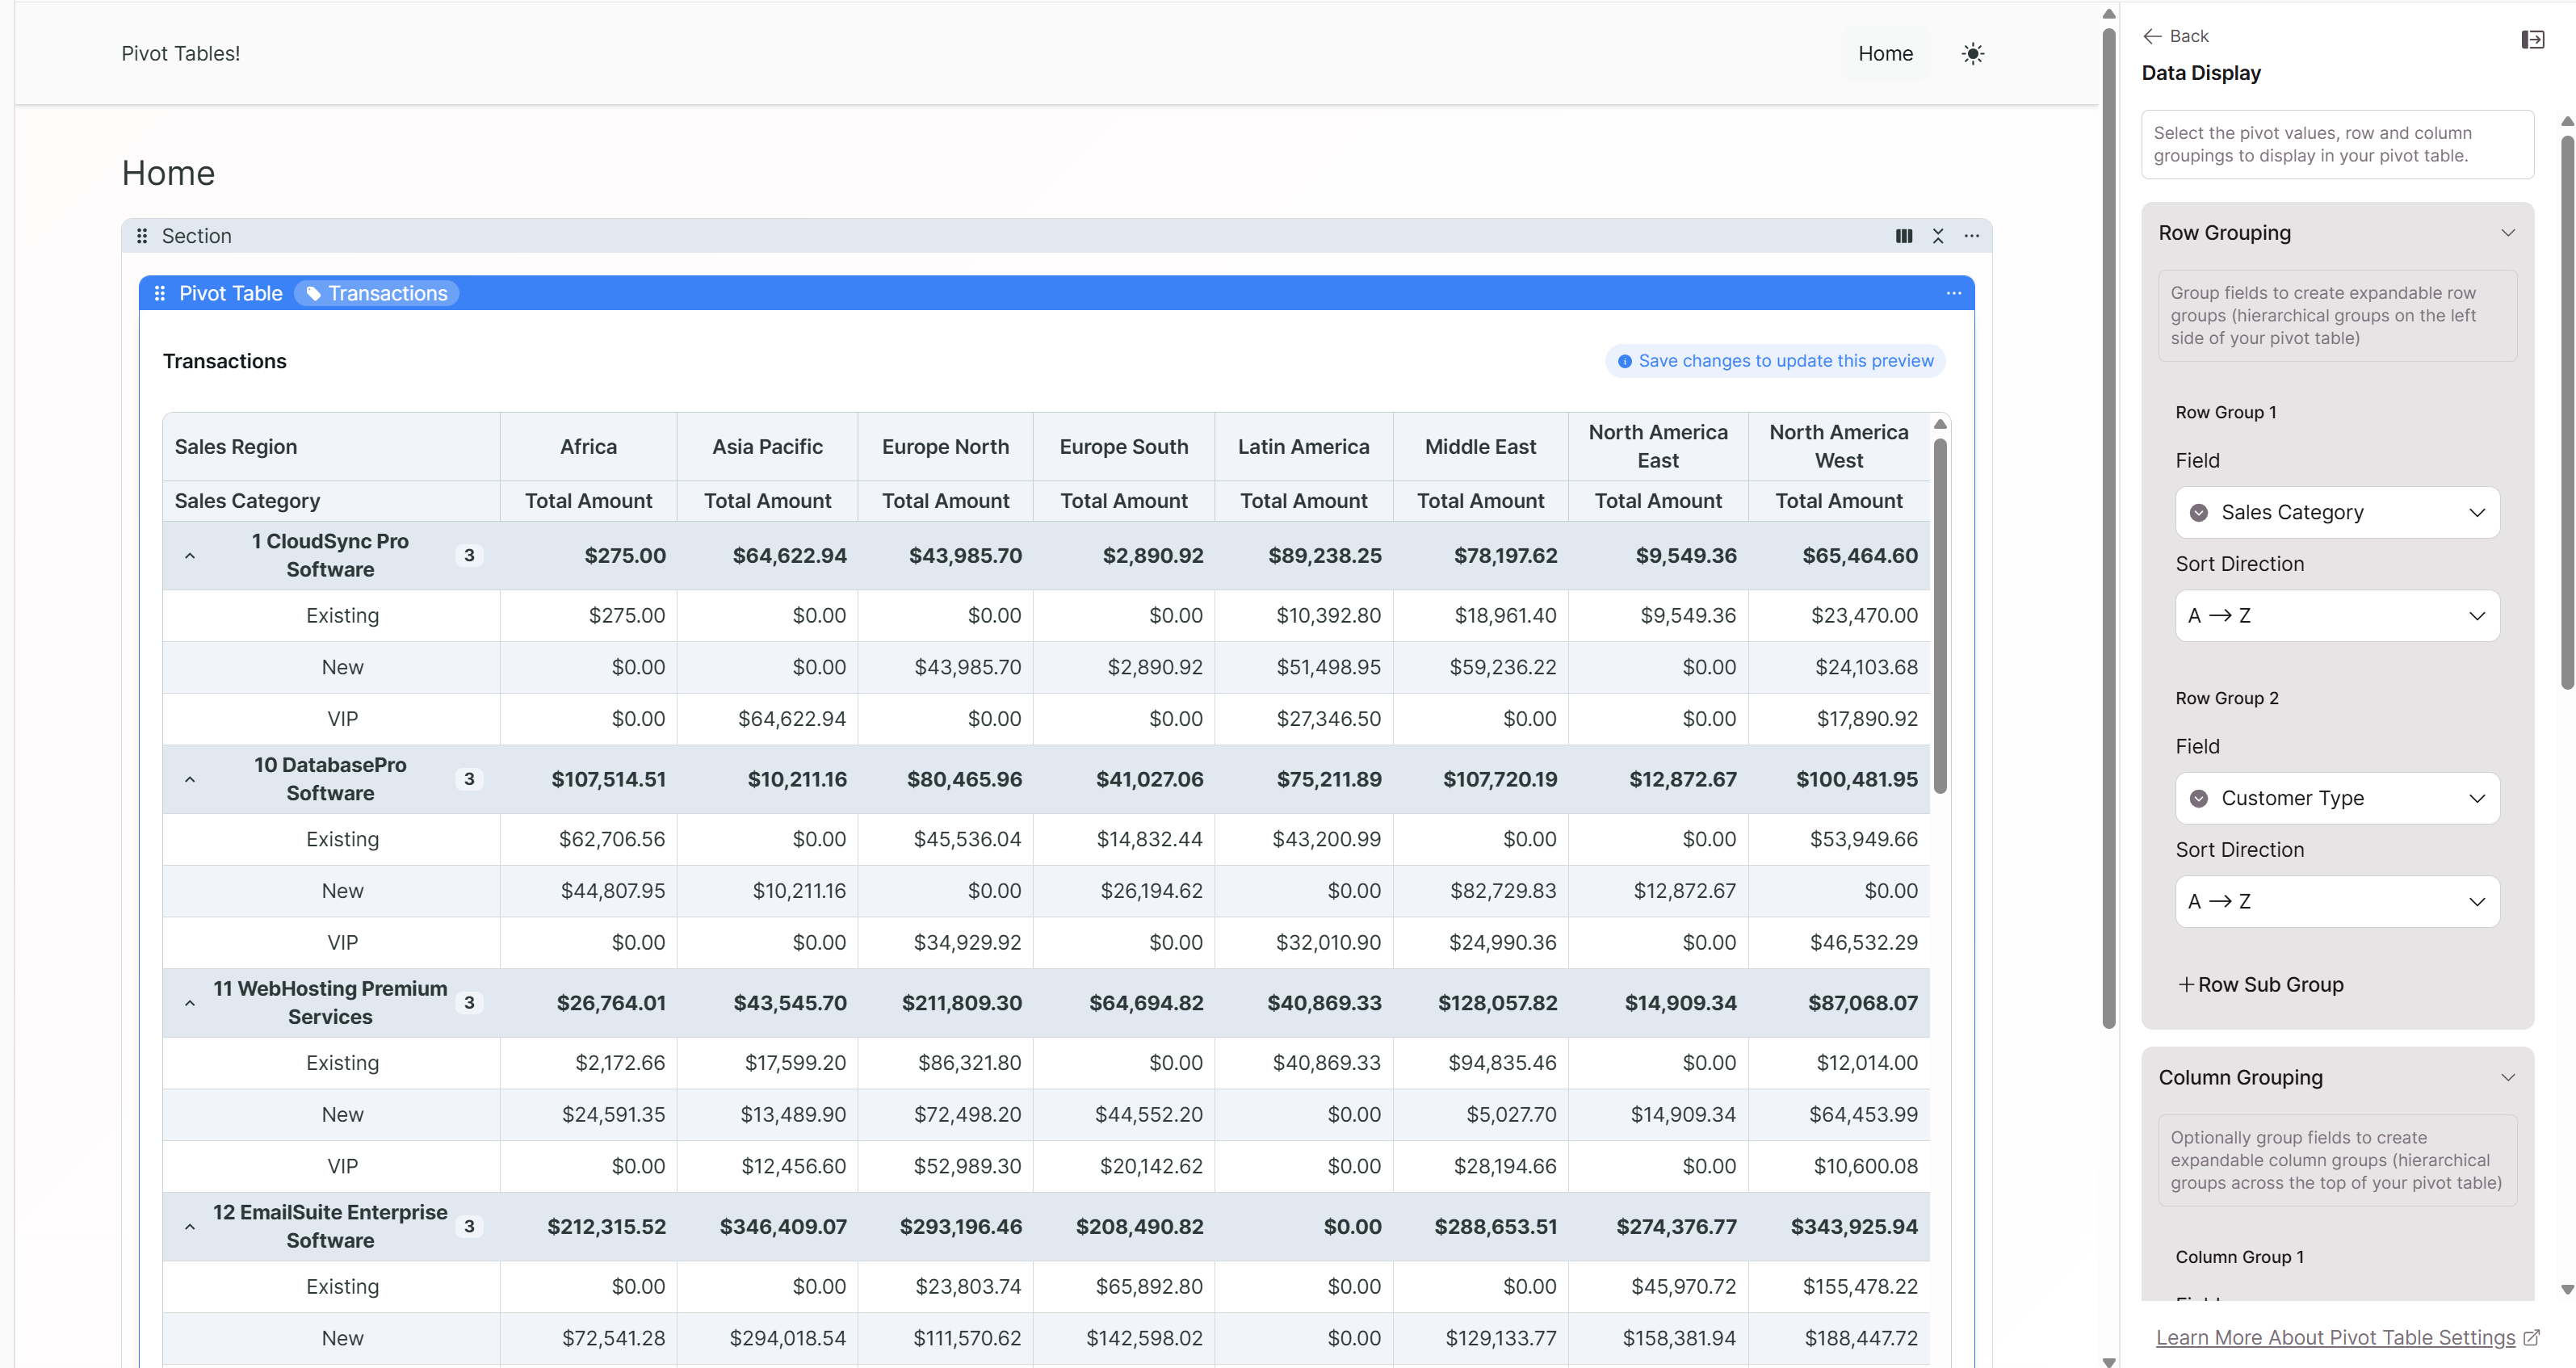
Row groupings create the left-side categories in your pivot table. When you select a field for row grouping, each unique value in that field becomes a separate row.
For example, if you group by "Product Category" and your data contains Electronics, Clothing, and Home Goods, your pivot table will have three rows—one for each category.
Setting Up a Primary Row Group
The primary row group (Row Group 1) is your main organizational dimension. Choose a field that represents the primary way you want to categorize your analysis.
Good choices for primary row groups:
- Product categories or types
- Departments or teams
- Project phases or statuses
- Customer segments
- Geographic regions
In the Data Display panel, select your field under Row Group 1. The pivot table will immediately organize data by the unique values in that field.
Adding Secondary Row Groups (Hierarchical Grouping)
Secondary row groups create a nested structure where each primary group expands to show subcategories. This enables drill-down analysis.
Example hierarchy:
| Row Group 1 | Row Group 2 | What It Shows |
|---|---|---|
| Sales Category | Customer Type | Revenue by category, broken down by B2B vs. B2C within each category |
| Department | Team Member | Performance by department, with individual contributor details |
| Project Phase | Task Status | Progress by phase, showing completion status within each phase |
When to use hierarchical grouping:
- You need to see both summary and detail views
- Your analysis requires drill-down capability
- You want to compare subcategories within larger categories
- You're building reports for different audience levels (executives see top level, managers see details)
Configuring Sort Order
Each row grouping can be sorted independently. Sorting options depend on the field type:
| Field Type | Available Sort Options |
|---|---|
| Text fields | A→Z (alphabetical) or Z→A (reverse alphabetical) |
| Number fields | Smallest to largest or largest to smallest |
| Date fields | Oldest to newest or newest to oldest |
Choose a sort order that makes your data logical to read. For time-based analysis, chronological sorting usually works best. For performance comparisons, sorting by value (largest first) can highlight top and bottom performers.
Grouping Limits
While you can create more than two row grouping levels, keep these constraints in mind:
- Total groupings cannot exceed 3,000 — This limit applies to the total number of unique combinations across all row and column groupings
- Performance degrades with complexity — More grouping levels means more data processing; keep hierarchies as shallow as practical
- Readability suffers with deep nesting — Three or more levels become difficult to scan; consider whether you need all levels visible simultaneously
Working with Connection Fields
You can use connection fields for row groupings to analyze data based on related records. For example, if your Transactions table connects to a Customers table, you can group transactions by customer attributes like Customer Type or Account Manager.
Connection fields appear in the field selection panel alongside direct table fields. Select them just as you would any other field.
Expandable Groups in the Live App
When you configure multiple row grouping levels, users viewing the pivot table can expand and collapse groups:
- Collapsed view: Shows only primary group rows with aggregated values
- Expanded view: Shows secondary groups nested under each primary group
This lets users start with a high-level summary and drill into details as needed.
Best Practices
Match hierarchy to your questions. If you're asking "How does each product category perform, and within that, how do different customer types compare?"—then Product Category should be Row Group 1 and Customer Type should be Row Group 2.
Put the most important dimension first. The primary row group drives the initial view users see. Choose the dimension that answers the primary question.
Keep it scannable. If your primary row group has more than 20-30 unique values, the pivot table becomes hard to scan. Consider whether you can use a higher-level grouping, or whether column grouping might work better for that field.
Test with real data. A field that seems like a good grouping candidate might have unexpected values (nulls, inconsistent formatting) that create confusing results. Preview your pivot table with actual data before publishing.
Related: Pivot Tables Overview | Column Groupings | Values and Calculations