Values and Calculations
How Values Work
Each cell in your pivot table displays a calculated value based on the records that match both its row and column grouping. The calculation method (summarization) determines how multiple matching records are combined into a single number.
For example, if you're analyzing sales by Product Category (rows) and Region (columns), each cell shows the calculated value for that specific category-region combination. A cell showing "Electronics + West" would calculate based only on electronic product sales in the West region.
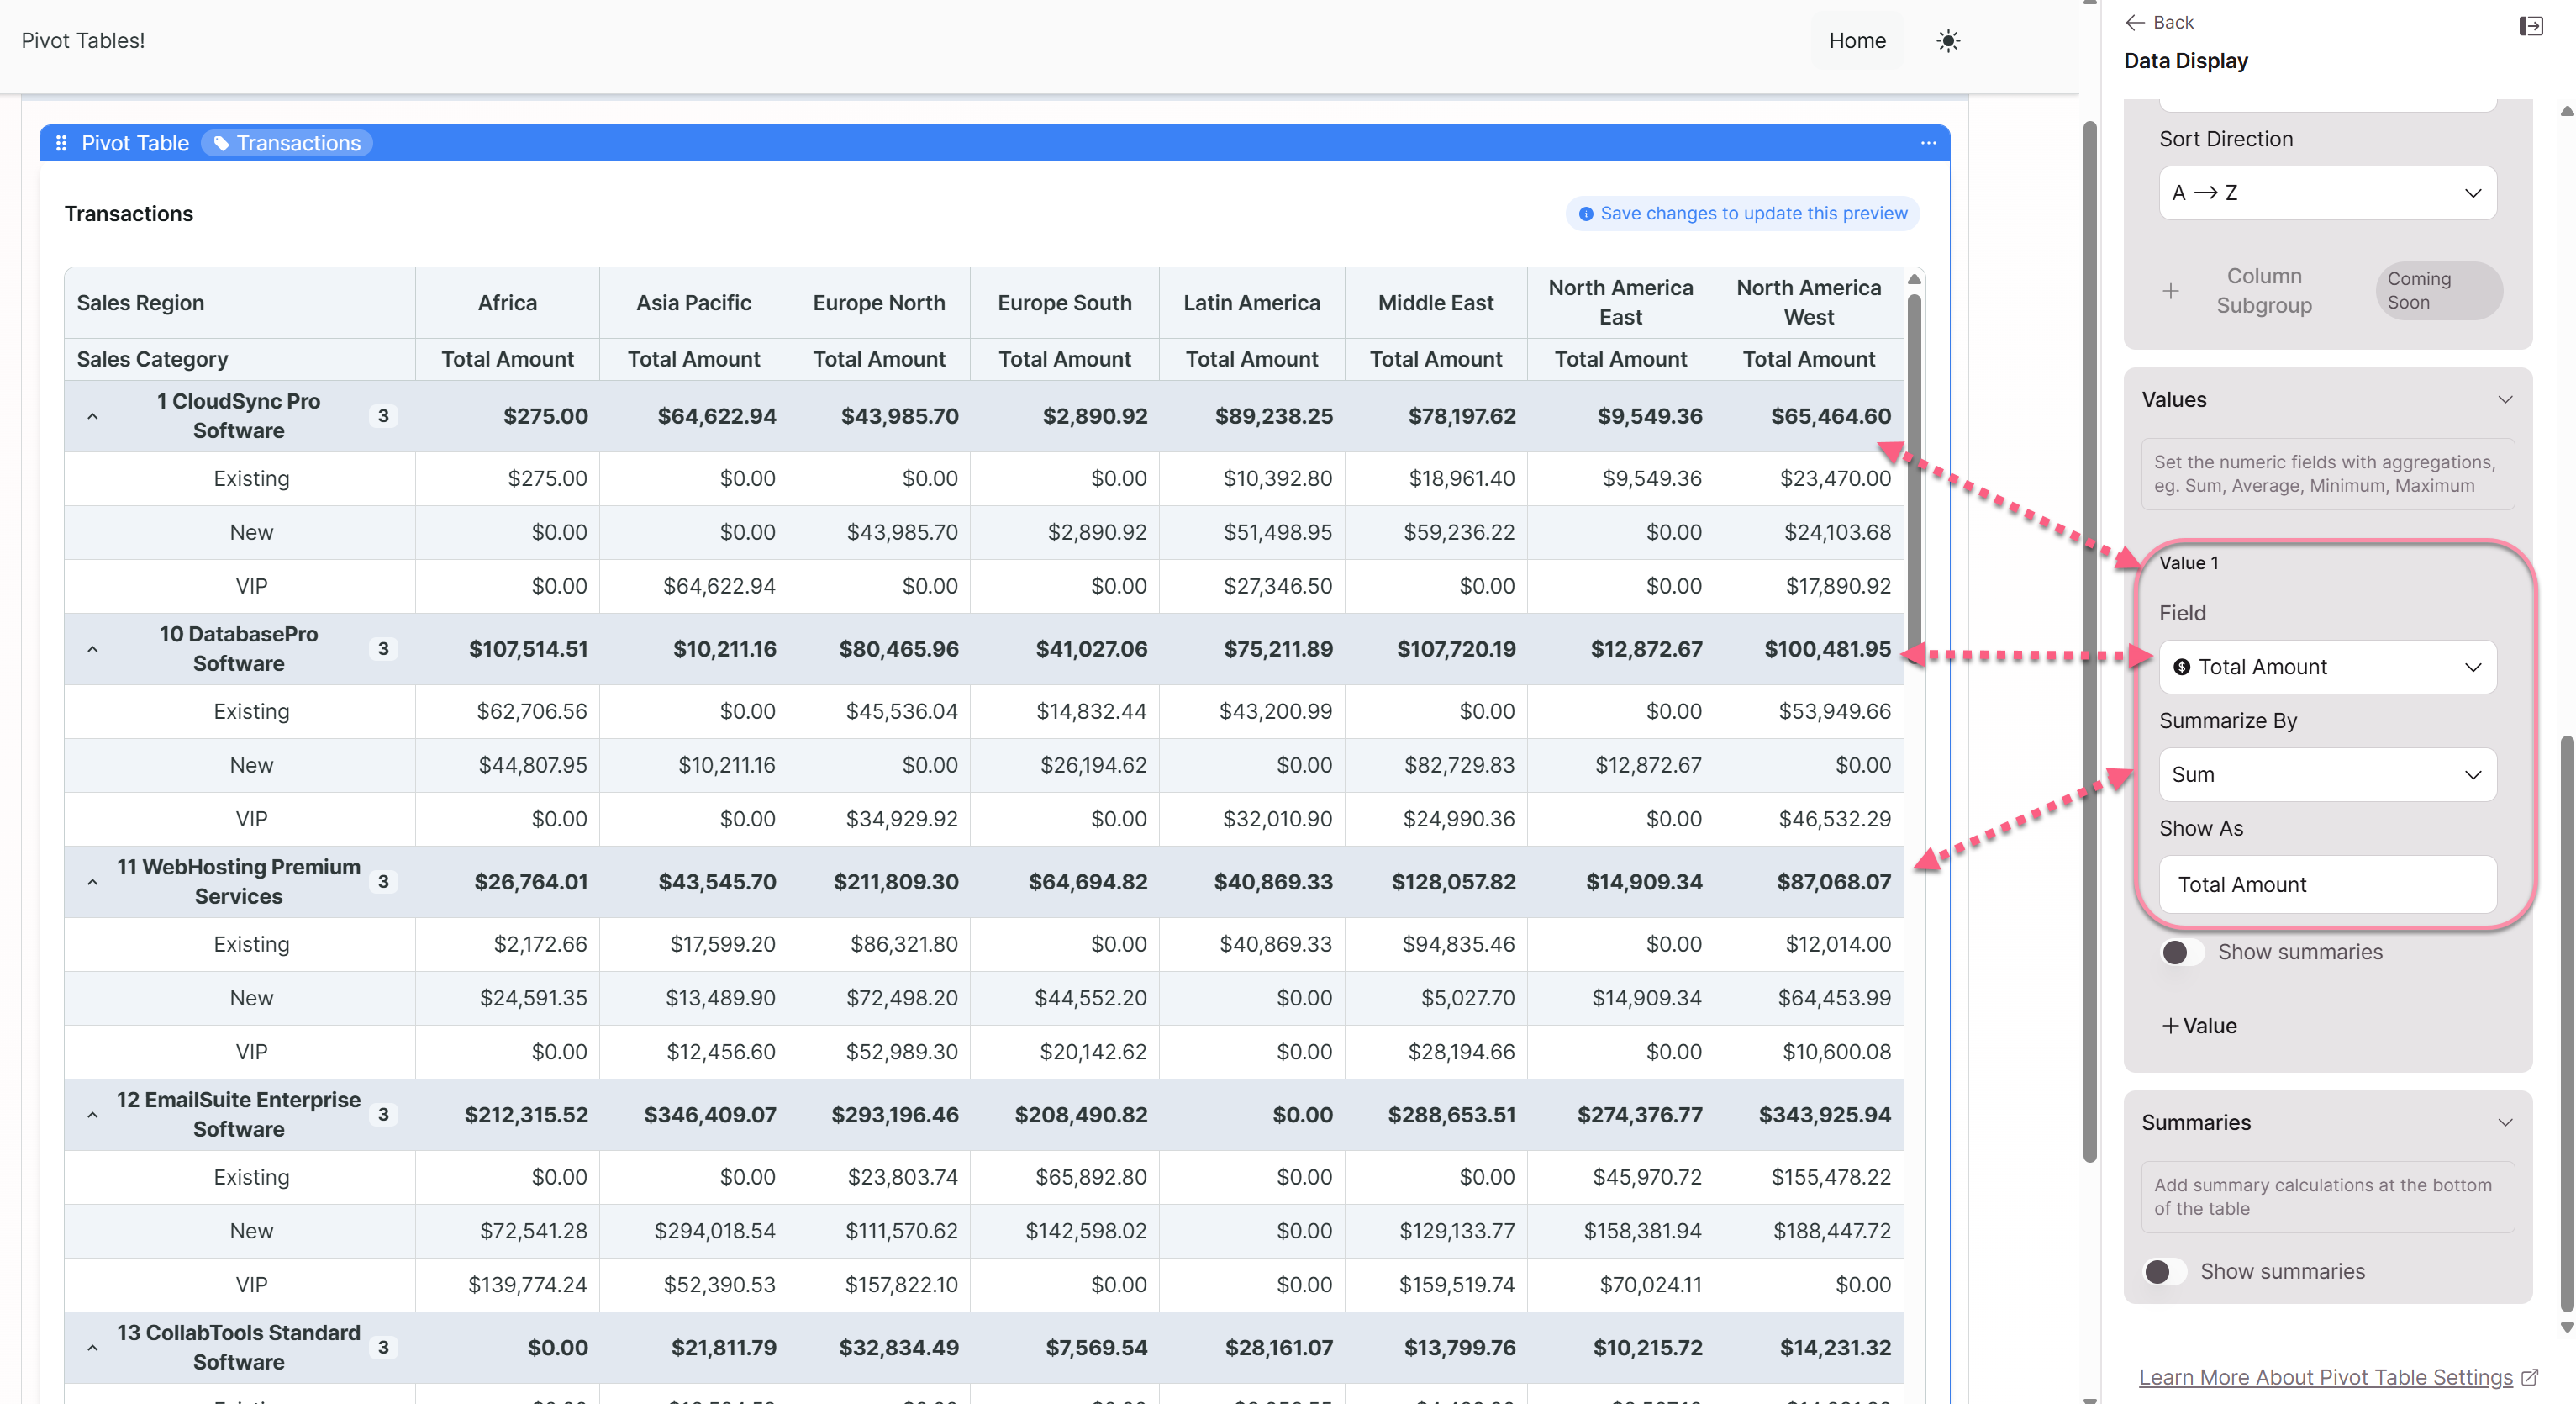
Setting Up Value Fields
In the Data Display panel, add fields to the Values section. For each value field, configure:
Field Selection: Choose a numeric field from your source table. This might include amounts, quantities, counts, ratings, durations, or any other measurable data.
Summarization Method: Select how values should be calculated (see next section).
Display Label: Customize the label that appears in the pivot table header. Use clear, descriptive names like "Total Revenue" rather than just "Amount."
Summarization Methods
Each summarization method serves different analytical purposes:
| Method | What It Calculates | Best For |
|---|---|---|
| Sum | Adds all values together | Total revenue, quantities, hours worked, cumulative metrics |
| Average | Calculates the mean | Typical order size, average rating, mean duration |
| Count | Counts the number of records | Volume, frequency, number of transactions |
| Minimum | Shows the lowest value | Identifying floor prices, fastest times, lowest scores |
| Maximum | Shows the highest value | Identifying peak values, top performers, outliers |
Choosing the right method:
- Use Sum when you care about totals: "How much total revenue did we generate?"
- Use Average when you care about typical values: "What's our average order size?"
- Use Count when you care about volume: "How many orders did we process?"
- Use Min/Max when you care about range or extremes: "What was our largest single sale?"
Multiple Value Fields
You can add multiple value fields to show different metrics simultaneously. Each value field becomes an additional column within each column grouping category.
Example configuration:
- Value 1: Total Amount (Sum) — shows total revenue
- Value 2: Total Amount (Average) — shows average transaction size
- Value 3: Transaction ID (Count) — shows number of transactions
This creates three columns for each column grouping value, letting you see revenue, average size, and volume side by side.
When to use multiple values:
- Comparing different perspectives on the same data (total vs. average)
- Showing related metrics together (revenue + profit margin)
- Providing context (count alongside sum helps interpret whether a large total came from many small transactions or few large ones)
Row Summaries
Row summaries add calculated totals at the end of each row, showing the aggregated value across all column grouping categories.
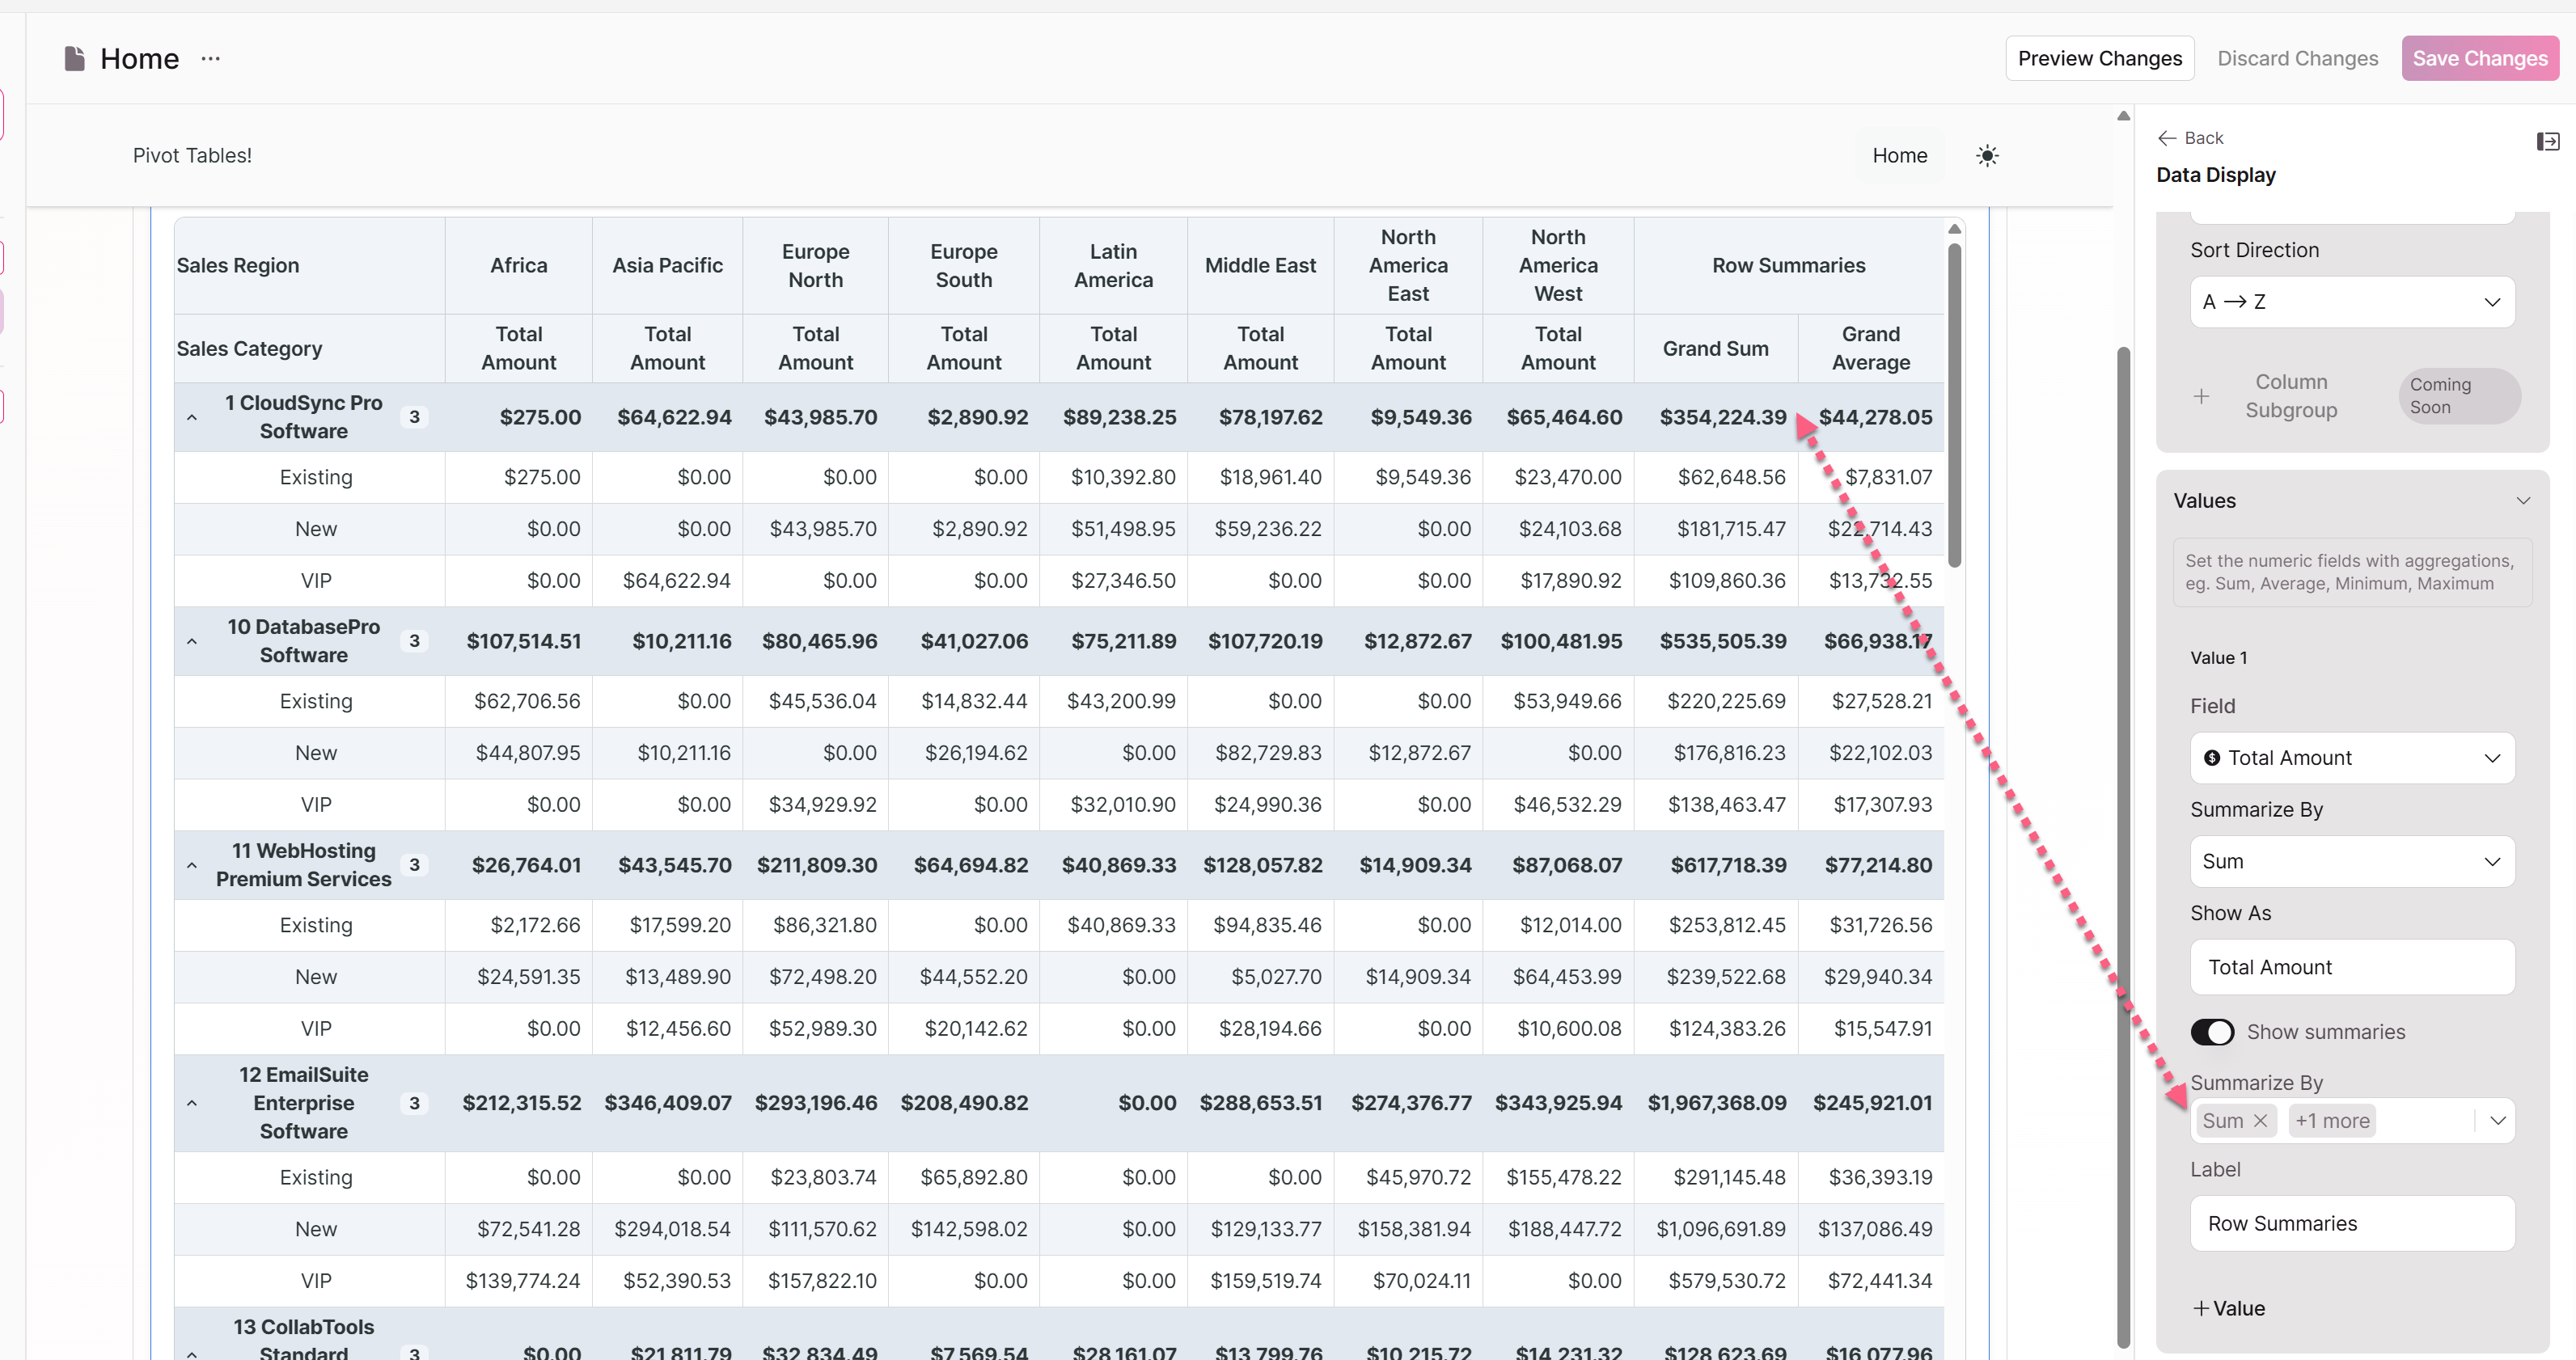
Enable row summaries with the "Show summaries" toggle. When enabled:
- Each row shows a summary value at the far right
- Hierarchical row groupings show subtotals at each level
- Grand totals appear for the entire dataset
Example: A pivot table showing Sales Category by Region would have a summary column showing total sales for each category across all regions.
Column Summaries
Column summaries add calculated totals at the bottom of each column, showing the aggregated value across all row grouping categories.
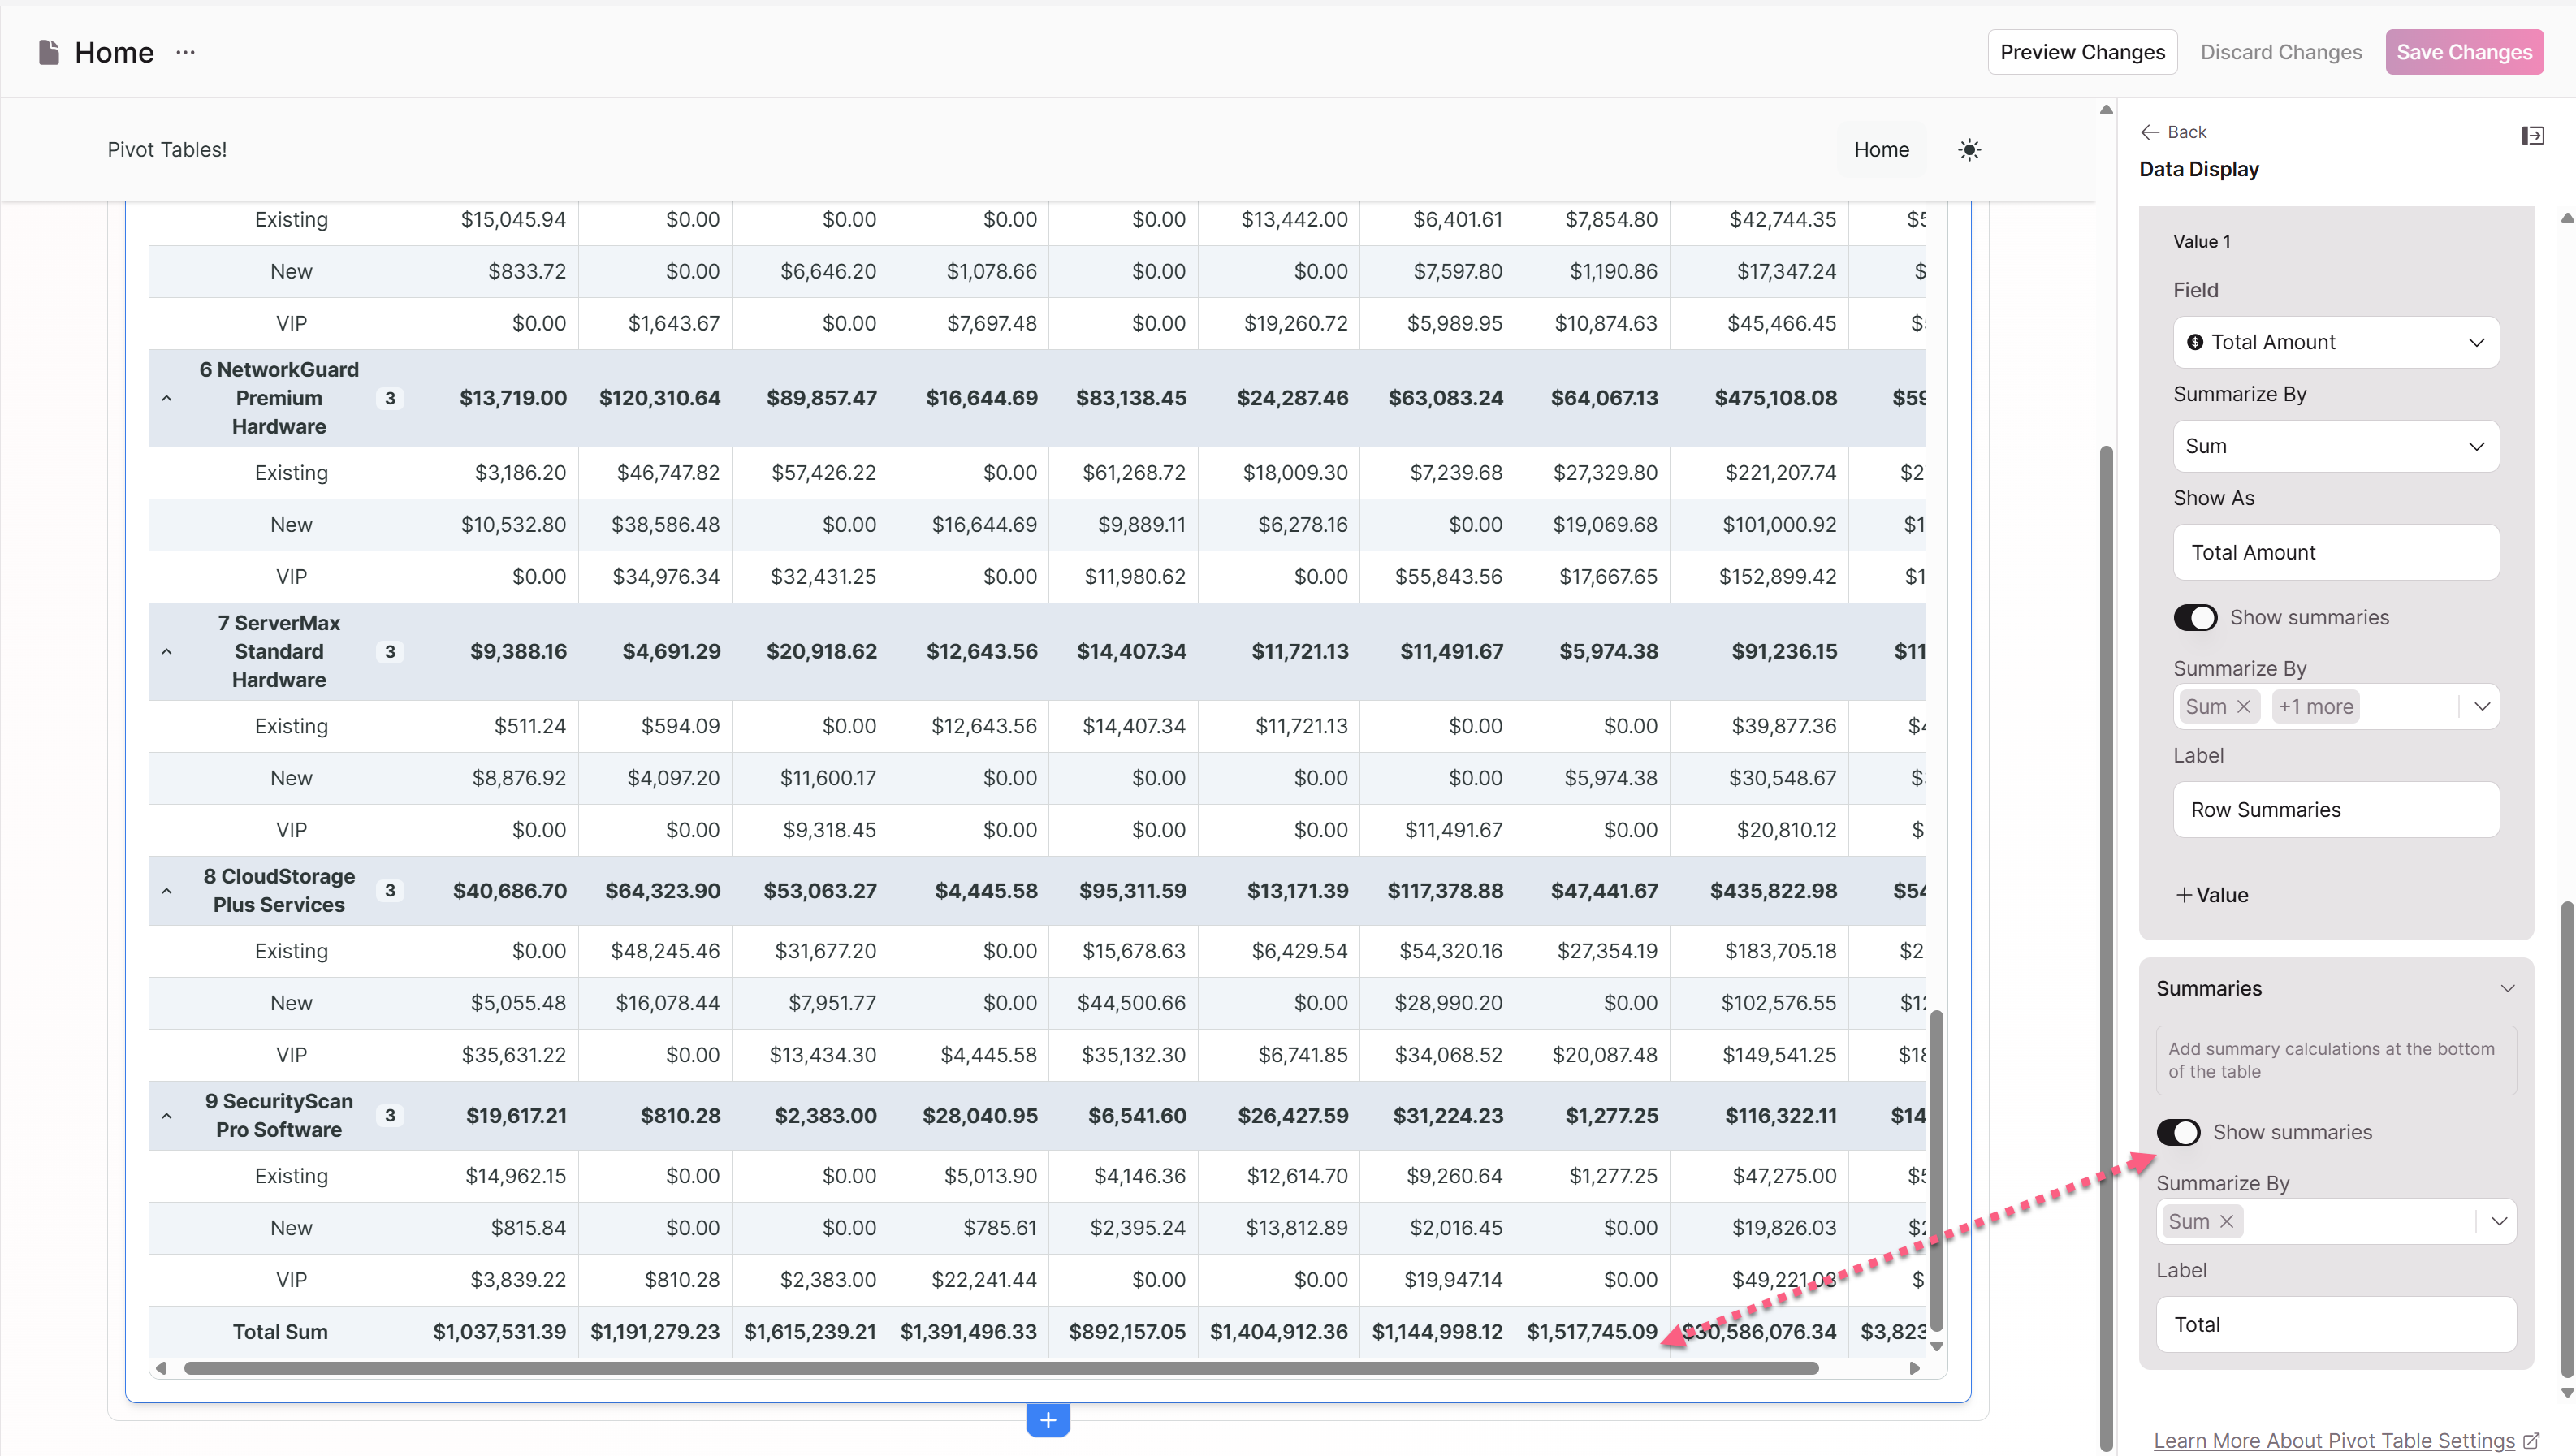
You can select one or more summarization methods for column summaries:
- Sum — total of all values in the column
- Average — mean of all values in the column
- Minimum — lowest value in the column
- Maximum — highest value in the column
Example: A column summary row showing Sum would display the total sales for each region across all product categories.
Available Field Types for Values
Your value fields can come from different sources:
Direct table fields: Numeric fields in your source table such as amounts, quantities, prices, and durations.
Connection fields: When your source table connects to other tables, you can access numeric fields from directly connected records.
System fields: Record counts and other system-generated metrics. Note that additional system fields like creation dates are coming in future updates.
Calculated fields: Some calculated fields in your table may be available for pivot table values.
Interpreting Cell Values
When reading your pivot table output, remember:
- Empty cells indicate no records matched that row-column combination
- Zero values indicate records exist but the calculated value is zero
- Large variances between Sum and Count suggest significant variation in individual record values
- Min = Max for a cell means only one record matched, or all matching records have the same value
Best Practices
Match the method to your question. Don't default to Sum for everything. If you're asking "What's typical?" use Average. If you're asking "How many?" use Count.
Provide context with multiple values. A Sum alone can be misleading. Showing Count alongside Sum helps viewers understand whether large totals came from many transactions or a few large ones.
Label clearly. "Total Revenue (Sum)" is better than "Amount." "Average Order Value" is better than "Amount (Average)." Clear labels prevent misinterpretation.
Don't overload. Three to four value fields is usually the practical maximum. More than that creates visual clutter and makes comparison difficult.
Enable summaries strategically. Row summaries are valuable when you want to compare totals across row categories. Column summaries help when you need to see totals for each column grouping. Both together provide grand totals. But not every pivot table needs summaries—simpler views can be clearer without them.
Related: Pivot Tables Overview | Row Groupings | Column Groupings | Pivot Table Examples